Erosion observations were conducted at various angular sections (i.e., 30°, 45°, 60°, and 90°, as shown in Figure 3-1) and at different positions on the bend wall (i.e., inner arch side, side wall surface, and outer arch side). As illustrated in Figure 3-2, the sample numbers for the 30° section are 1, 2, and 3; for the 45° section, they are 4, 5, and 6; for the 60° section, they are 7, 8, and 9; and for the 90° section, they are 10, 11, and 12. The sample numbers for the inner arch side are 1, 4, 7, and 10; for the side wall surface, they are 2, 5, 8, and 11; and for the outer arch side, they are 3, 6, 9, and 12. Table 3-4 presents the changes in sample mass in the bend under varying particle concentrations. Figure 3-5 shows the weight loss rates of samples at different cross-sections, while Figure 3-6 illustrates the weight loss rates at different wall positions under various particle concentrations.
Table 3-4: Mass Change of Samples in the Bend with Different Particle Concentrations
No. | Weight Loss (g) - 5% | 10% | 15% | Weight Loss Rate (%) - 5% | 10% | 15% |
1 | -0.0001 | -0.0001 | -0.0002 | -0.01 | -0.01 | -0.01 |
2 | 0.0000 | 0.0001 | 0.0003 | 0.00 | 0.00 | 0.02 |
3 | 0.0007 | 0.0011 | 0.0015 | 0.04 | 0.06 | 0.08 |
4 | -0.0007 | -0.0010 | 0.0003 | -0.04 | -0.05 | 0.02 |
5 | 0.0003 | 0.0007 | 0.0006 | 0.02 | 0.04 | 0.03 |
6 | 0.0013 | 0.0019 | 0.0021 | 0.07 | 0.10 | 0.11 |
7 | -0.0011 | -0.0010 | 0.0013 | -0.06 | -0.05 | 0.07 |
8 | 0.0009 | 0.0013 | 0.0015 | 0.05 | 0.07 | 0.08 |
9 | 0.0016 | 0.0024 | 0.0030 | 0.08 | 0.12 | 0.18 |
10 | 0.0005 | -0.0019 | 0.0021 | 0.03 | -0.10 | 0.10 |
11 | 0.0017 | 0.0026 | 0.0029 | 0.08 | 0.13 | 0.15 |
12 | 0.0025 | 0.0030 | 0.0035 | 0.13 | 0.15 | 0.18 |
(a) Inner arch side (b) Side wall (c) Outer arch side
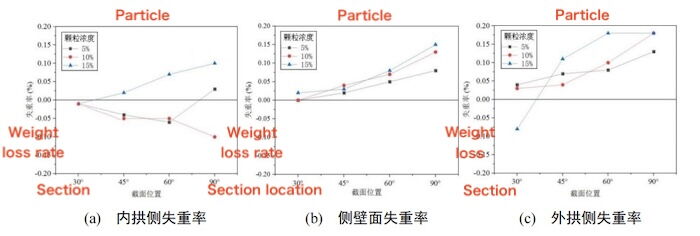
Figure 3-6 Weight loss rates of samples at different wall surfaces in bends with varying particle concentrations
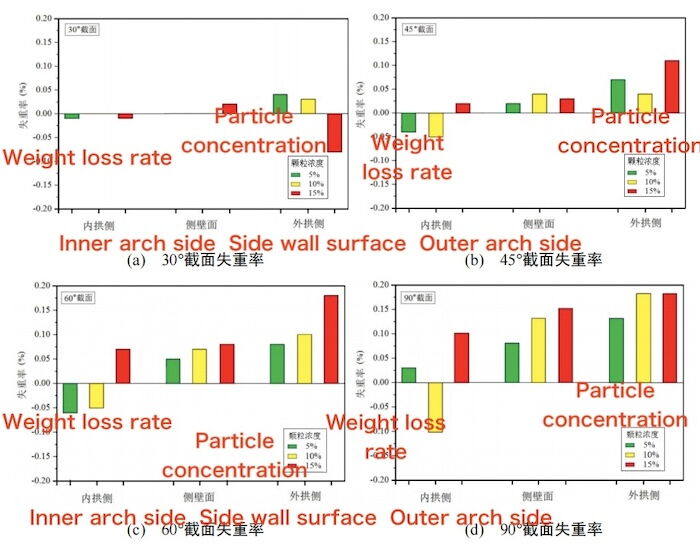
(a) 30° cross-section (b) 45° cross-section (c) 60° cross-section (d) 90° cross-section
Figure 3-7 Weight loss rates of samples at different cross-sectional angles in bends with varying particle concentrations
As shown in Table 3-4, some samples exhibit an increase in mass after the experiment. Upon comparison, it is found that these are primarily samples taken from bends with low particle concentrations and from the inner arch side at small-angle sections. The main reason is that the impact on the inner arch side is relatively mild, and the erosion causes minimal damage to the material matrix. Minor surface scratches have little effect on mass loss. Additionally, the polished samples, after prolonged immersion in the fluid, tend to form corrosion products. These products are not fully removed by subsequent particle collisions, leading to a net increase in sample mass.
Figures 3-6 and 3-7 further illustrate that erosion on the outer arch side remains relatively intense, resulting in a higher weight loss rate for samples from the outer arch side compared to those from the side wall and the inner arch side. Due to the lower erosion intensity, samples from the inner arch side exhibit the lowest weight loss rate—and in some cases, even show a mass gain. The side wall samples show a higher weight loss rate than those on the inner arch side but lower than those on the outer arch side.
With increasing particle concentration, the weight loss rates of samples from both the side wall and outer arch side increase accordingly. Specifically, at a particle concentration of 5%, the average weight gain of inner arch side samples is 0.02%; at 10%, it is 0.03%; and at 15%, it turns into an average weight loss of 0.045%. The average weight loss of side wall samples is 0.0375% at 5%, 0.06% at 10%, and 0.07% at 15%. For the outer arch side, the average weight loss is 0.08% at 5%, 0.1075% at 10%, and 0.1375% at 15%.
Effect of Curvature Radius on Erosion of the Inner Wall of the Bend
Erosion observations were conducted at different angular sections (i.e., 30°, 45°, 60°, and 90°, as shown in Figure 3-1) and at various wall positions (i.e., inner arch side, side wall surface, and outer arch side wall surface). As shown in Figure 3-2, the specimens corresponding to the 30° section are numbered 1, 2, and 3; those corresponding to the 45° section are numbered 4, 5, and 6; the 60° section includes specimens 7, 8, and 9; and the 90° section includes specimens 10, 11, and 12. The specimens located on the inner arch side are numbered 1, 4, 7, and 10; those on the side wall are numbered 2, 4, 6, and 8; and those on the outer arch side are numbered 3, 6, 9, and 12. Table 3-5 presents the changes in mass of the samples in bends at different flow rates. Figure 3-8 illustrates the weight loss rates of samples from different cross sections under varying flow rates, while Figure 3-9 shows the weight loss rates of samples from different wall surfaces under the same conditions.
Table 3-5 Mass Changes of Samples in Bends with Different Curvature Radii
Specimen No. | Weight Loss (g) — R = 2.5D | R = 3.5D | R = 5D | Weight Loss Rate (%) — R = 2.5D | R = 3.5D | R = 5D |
1 | -0.0004 | -0.0001 | -0.0004 | -0.02 | -0.01 | -0.02 |
2 | 0.0001 | 0.0001 | 0.0001 | 0.01 | 0.00 | 0.01 |
3 | 0.0010 | 0.0011 | 0.0004 | 0.05 | 0.06 | 0.02 |
4 | -0.0001 | -0.0010 | -0.0013 | -0.01 | -0.05 | -0.07 |
5 | 0.0008 | 0.0007 | 0.0003 | 0.04 | 0.04 | 0.02 |
6 | 0.0016 | 0.0019 | 0.0011 | 0.08 | 0.10 | 0.06 |
7 | -0.0023 | -0.0010 | -0.0018 | -0.12 | -0.05 | -0.09 |
8 | 0.0011 | 0.0013 | 0.0006 | 0.06 | 0.07 | 0.03 |
9 | 0.0022 | 0.0024 | 0.0015 | 0.11 | 0.12 | 0.08 |
10 | -0.0004 | -0.0019 | -0.0010 | 0.02 | -0.10 | -0.05 |
11 | 0.0023 | 0.0026 | 0.0013 | 0.12 | 0.13 | 0.07 |
12 | 0.0028 | 0.0030 | 0.0021 | 0.14 | 0.15 | 0.11 |
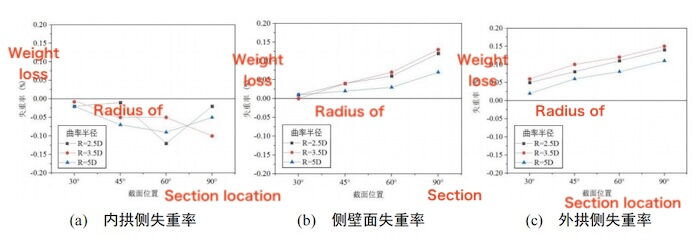
(a)Weight loss rate of the inner arch side (b) Weight loss rate of the side wall (c) Weight loss rate of the outer arch side
Figure 3-8 Weight loss rate of samples with different cross-sections in bends with different curvature radii
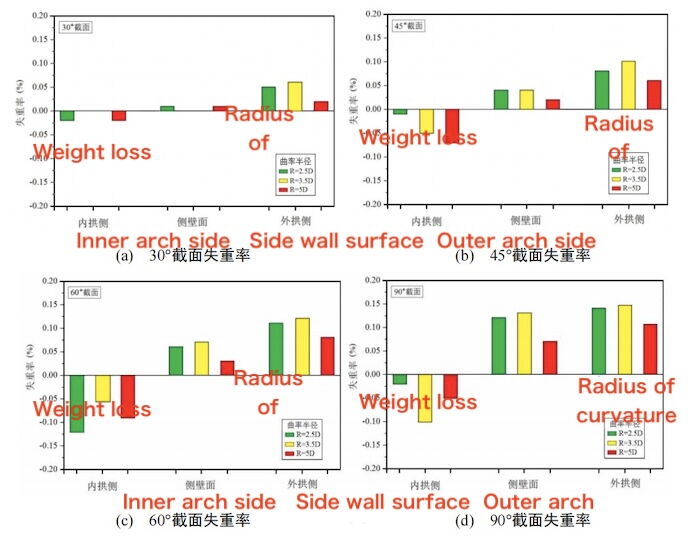
(a) Weight loss rate of the 30° cross-section (b) Weight loss rate of the 45° cross-section (c) Weight loss rate of the 60° cross-section (d) Weight loss rate of the 90° cross-section
Figure 3-9 Weight loss rate of samples with different wall surfaces in bends with different curvature radii
Since the impact on the inner arch side wall is relatively mild, some samples show an increase in weight after the experiment, as shown in Table 3-5. From Figures 3-8 and 3-9, it can be observed that the erosion strength of the sample on the inner arch side wall is relatively low. However, the erosion strength of the side wall and the outer arch side wall increases with the angle, due to the superposition of secondary flow and centrifugal force.
For the two experimental bends, R = 2.5D and R = 3.5D, the weight loss rates of the side wall and outer arch side wall samples are similar, and they are greater than the weight loss rate of the wall samples for the R = 5D experimental bend.
After calculations, the average weight increase of the inner arch side samples at the particle concentration flow rate of R = 2.5D was 0.0425%, the average weight increase at R = 3.5D was 0.03%, and at R = 5D was 0.575%. The average weight loss of the side wall samples at R = 2.5D was 0.0575%, at R = 3.5D was 0.06%, and at R = 5D was 0.0325%. The average weight loss of the outer arch side samples at R = 2.5D was 0.095%, at R = 3.5D was 0.1075%, and at R = 5D was 0.0675%.
Post URL: https://www.landeepipefitting.com/effect-of-particle-concentration-on-erosion-of-the-inner-wall-of-the-bend.html
Landee is a professional industrial pipe fitting manufacturer and be well accepted by customers all over the world, we has been producing Pipe Fitting for a variety of applications since 1985. welcome to access our website: https://www.landeepipefitting.com.
Next: Failure Analysis of Surge Pipe Elbow in the Top Cover of a Large Hydropower Station
